Unlocking the Power of Trading View: The Ultimate Guide for Traders and Investors
Introduction to Trading View and Its Capabilities
In the fast-paced world of financial markets, effective analysis tools are crucial for making informed trading decisions. Among the myriad platforms available, trading view stands out as a comprehensive and versatile charting and analysis platform that caters to traders of all levels. Whether you’re a beginner exploring the markets or a seasoned professional, understanding how to leverage Trading View’s capabilities can significantly enhance your trading strategy and improve your overall performance.
Trading View is more than just a charting tool—it combines real-time data, advanced technical analysis features, and a vibrant community of traders sharing insights and strategies. Its intuitive interface and extensive customization options make it an indispensable resource for analyzing stocks, cryptocurrencies, forex, commodities, and more. In this guide, we’ll explore the core features that make Trading View a powerful platform, along with practical tips on how to maximize its potential for your trading journey.
Core Features of Trading View
Advanced Charting and Technical Indicators
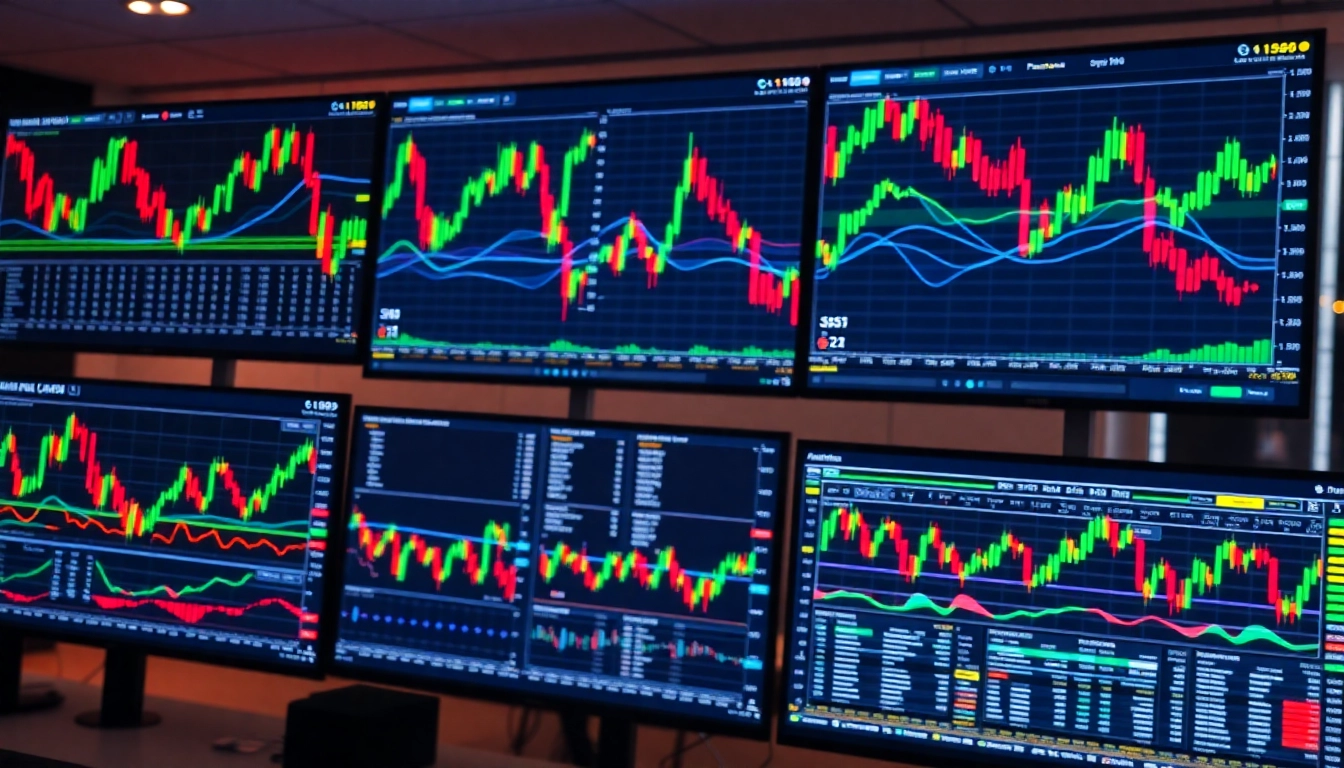
At the heart of Trading View is its state-of-the-art charting engine. Users can access a wide array of chart types—candlestick, line, bar, Renko, and more—to visualize market movements precisely. The platform supports hundreds of pre-built technical indicators such as Moving Averages, RSI, MACD, Bollinger Bands, and Fibonacci retracements, allowing traders to identify trend directions, momentum shifts, and potential reversal points effectively.
What sets Trading View apart is its flexibility in combining multiple indicators onto a single chart, creating custom overlays to suit individual trading styles. For example, a trader might overlay a 200-day moving average with Bollinger Bands to spot volatility breakouts or trend continuations. The ability to customize indicator parameters further fine-tunes analysis, making the platform adaptable to any market condition.
Real-Time Data and Multi-Market Coverage
One of Trading View’s strongest features is its access to real-time data across global markets. From US equities and forex pairs to cryptocurrencies and commodities, traders have instant visibility into market movements worldwide. This extensive coverage ensures that users can monitor multiple assets simultaneously, facilitating cross-market analysis and diversification strategies.
Additionally, Trading View offers live alerts based on price levels, indicator signals, or custom conditions, which can be sent via pop-ups, emails, or SMS. This proactive approach helps traders stay responsive to market changes without constant monitoring.
Social Trading and Community Insights
Trading View doesn’t operate in isolation; it integrates a social network where traders and investors share ideas, scripts, and strategies. Users can publish their analyses, comment on others’ ideas, and follow experienced traders for insights. This collaborative environment accelerates learning and provides diverse perspectives, turning individual analysis into a community-driven learning experience.
Community ideas often include pre-built scripts, detailed commentary, and trade setups, which can serve as educational resources or inspiration for your own trades.
Customizable User Interface and Layouts
Efficiency in trading is often defined by how well you can organize your workspace. Trading View offers extensive customization options—including multiple chart layouts, color schemes, and keyboard shortcuts. Users can create dedicated layouts for specific assets or markets, enabling rapid switching and comparison.
Furthermore, watchlists can be tailored with favorite assets, and color-coded alerts help prioritize trading opportunities, making the interface both functional and user-friendly.
How to Effectively Use Trading View for Market Analysis
Reading Charts and Technical Indicators
Mastering chart reading is foundational to successful trading. Begin by selecting the appropriate chart type based on your trading style. Candlestick charts are popular among day traders for their ability to display price action and patterns vividly.
Next, incorporate technical indicators aligned with your trading plan. For instance, trend-following traders may prioritize Moving Averages, while swing traders might focus on RSI and MACD to identify overbought or oversold conditions. Combining multiple indicators, such as volume-weighted average price (VWAP) with Bollinger Bands, can improve signal accuracy.
It’s essential to interpret these signals in the context of overall market sentiment and confirmation from multiple sources—do not rely on a single indicator for trading decisions.
Utilizing Trading Alerts and Notifications
One of the platform’s most powerful features is its customizable alerts. By setting alerts for specific price levels, indicator crossovers, or pattern formations, traders can automate awareness of trading opportunities or risk management triggers. For example, an alert can notify you when a stock crosses above its 50-day moving average or when Bitcoin’s price hits a key support level.
This functionality reduces the need for constant manual monitoring and ensures timely execution, especially crucial in volatile markets.
Integrating Trading View with Other Tools
While Trading View is comprehensive on its own, integrating it with brokerage accounts and trading platforms streamlines order execution. Many brokers support direct trading from Trading View charts, allowing traders to act immediately on analysis without switching screens.
Additionally, API integrations enable automation strategies and synchronization with third-party tools like risk management software or portfolio trackers, cultivating an efficient and cohesive trading environment.
Advanced Trading Strategies on Trading View
Developing Strategies with Scripts and Custom Indicators
Trading View’s scripting language, Pine Script, empowers traders to create custom indicators, strategies, and alerts tailored to their specific criteria. For example, a trader might develop a script to identify a rare candlestick pattern combined with volume spikes, providing a precise trading signal.
Access to a vast public library of community-contributed scripts accelerates learning and strategy development. Reviewing successful scripts can inspire new approaches or enhance existing ones.
Backtesting and Paper Trading
Before risking real capital, traders can backtest strategies using Trading View’s historical data, assessing performance metrics such as win rate, profit factor, and drawdowns. The platform allows simulation of trades based on predefined rules, helping optimize strategy parameters and reduce potential losses.
Additionally, paper trading enables live market testing without financial risk, building confidence and refining tactics based on real-time feedback.
Analyzing Multiple Markets Simultaneously
Trading View’s multi-chart layouts enable traders to monitor and analyze several markets concurrently. For instance, comparing correlation patterns between gold, USD, and crude oil helps in understanding macroeconomic trends influencing multiple assets.
This comprehensive view supports more informed decisions and diversification strategies, essential for managing risk effectively.
Improving Trading Performance with Trading View
Monitoring Performance Metrics and Progress
Tracking your trading performance is critical for continual improvement. Trading View allows users to log trades, analyze profitability, and identify strengths and weaknesses. Regular review of trade history and performance metrics helps refine strategies and set realistic goals.
Using Community Ideas for Market Insights
Engaging with community ideas offers fresh perspectives and diverse analysis methods. Study popular ideas with high engagement to understand different analytical approaches. Incorporate insights selectively, aligning them with your trading plan to enhance decision-making.
Staying Updated with Real-Time News and Analysis
Timely news can significantly impact markets. By integrating news feeds or following influential traders within Trading View, you gain access to breaking updates and market sentiment shifts. Combining technical analysis with fundamental news ensures a holistic approach to trading.
Best Practices and Tips for Maximizing Trading View
Customizing Watchlists and Layouts for Efficiency
Create specific watchlists for different asset classes or trading strategies, allowing quick access and monitoring. Designing tailored layouts for day trading, swing trading, or macro analysis enhances workflow efficiency and reduces clutter.
Regularly Updating and Refining Strategies
Markets evolve, and so should your approaches. Periodically revisiting your scripts, indicators, and charts ensures your analysis remains relevant. Using Trading View’s collaborative features, seek feedback and stay informed about emerging tools.
Securing Your Account and Data Privacy Tips
Protect your trading data by enabling two-factor authentication, using strong passwords, and avoiding sharing sensitive account information. Regularly updating your security settings minimizes risks associated with cyber threats.